Security
What is Information Security?
Computer security or cybersecurity according to ISACA (Information Systems Audit and Control Association) is the protection of information assets, through the treatment of threats that put at risk the information that is processed, stored and transported by the information systems that are interconnected.
How do I go to the Security menu?
The Security Dashboard allows you to quickly view all the options related to the security of your services.
To go to this section, click on the "Security" option, located in the side menu of your SWPanel.
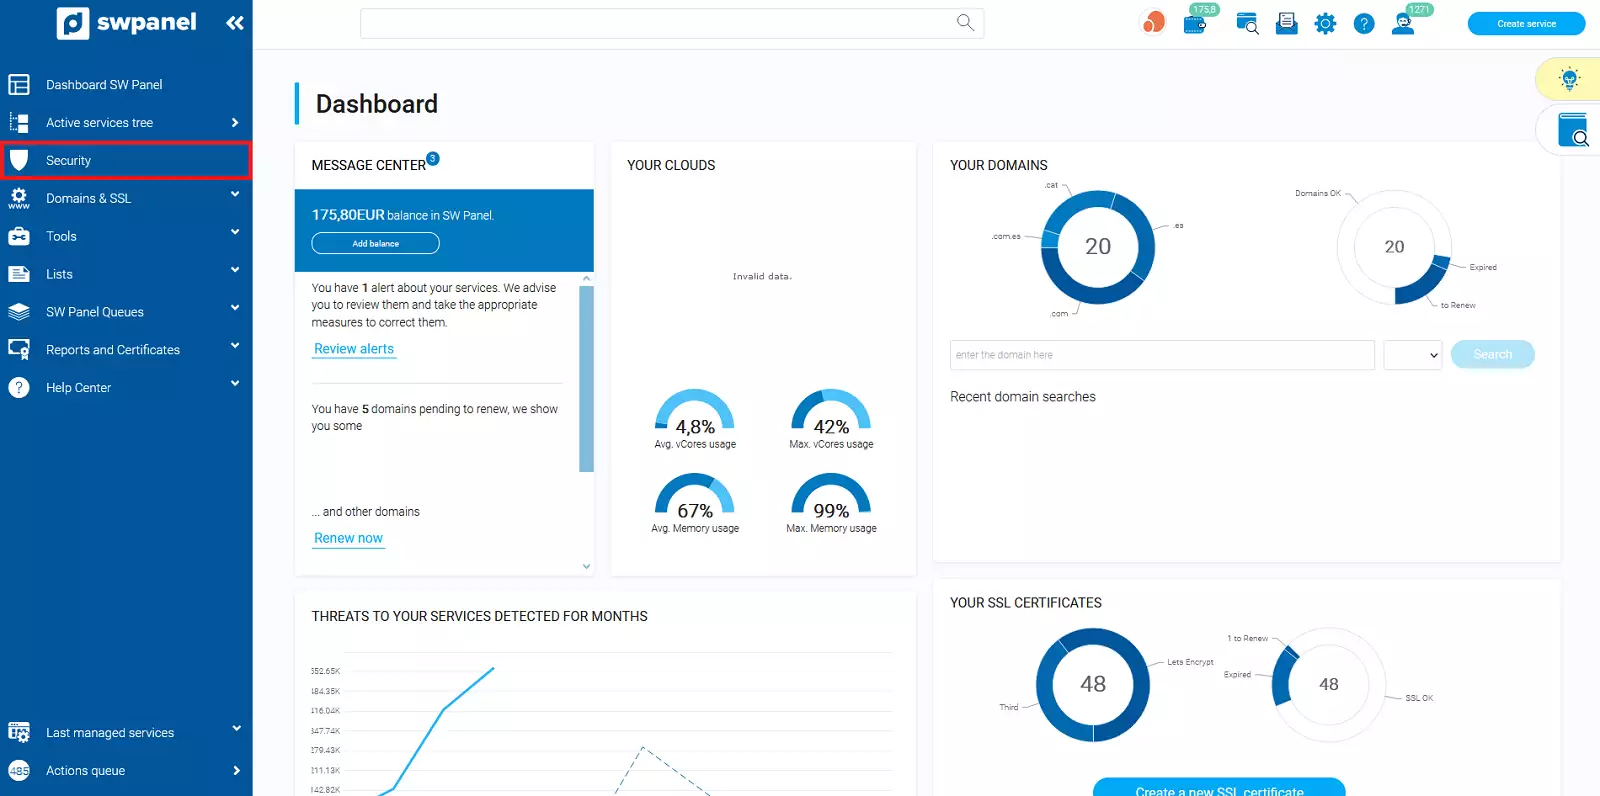
Security Dashboard
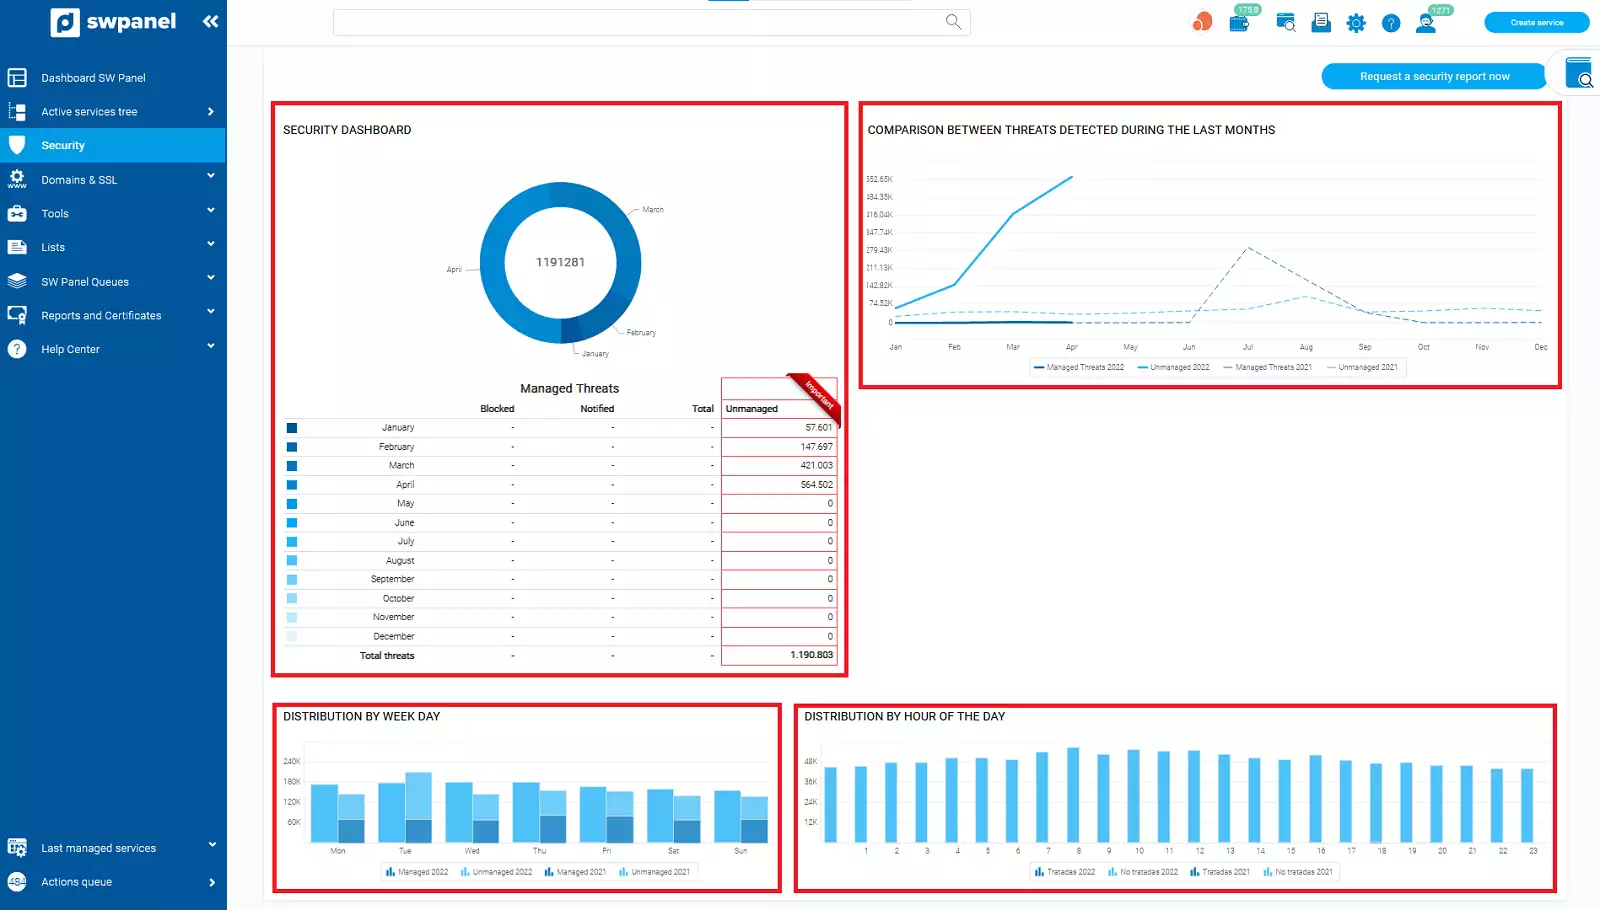
From the following Dashboard you will be able to see some data about the security of your services and the different graphs about the detected threats.
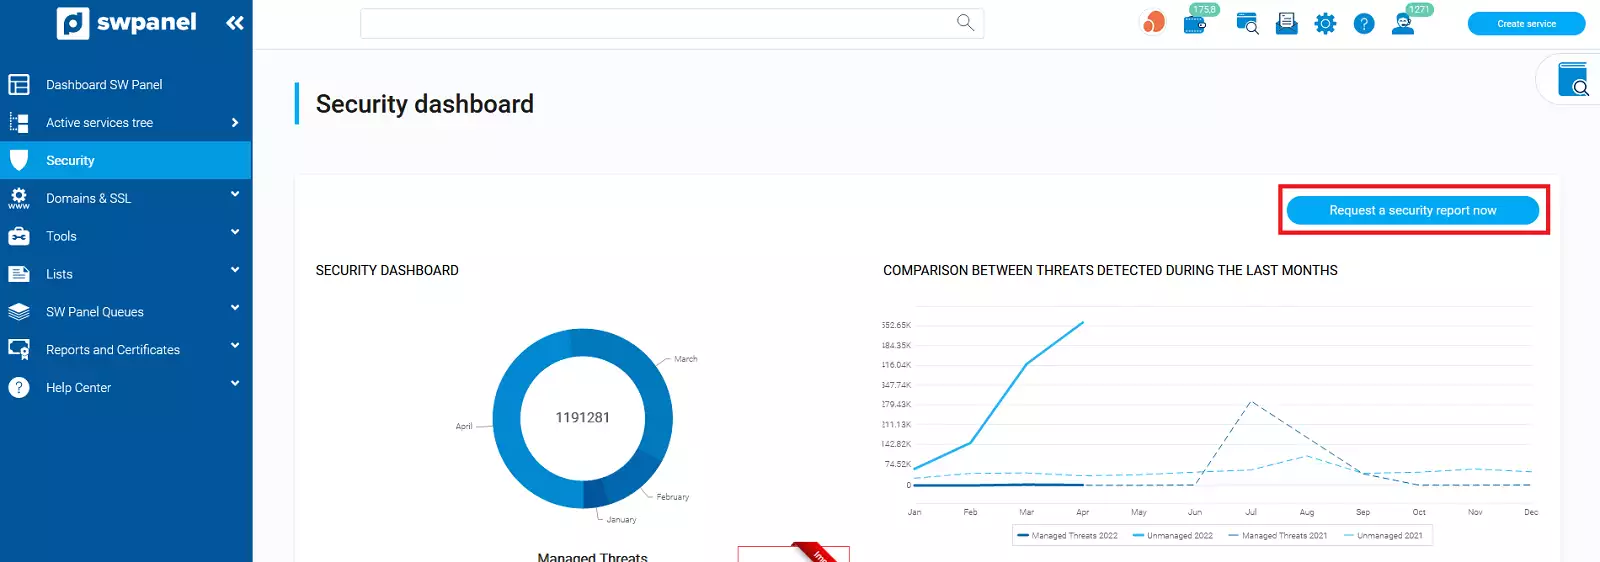
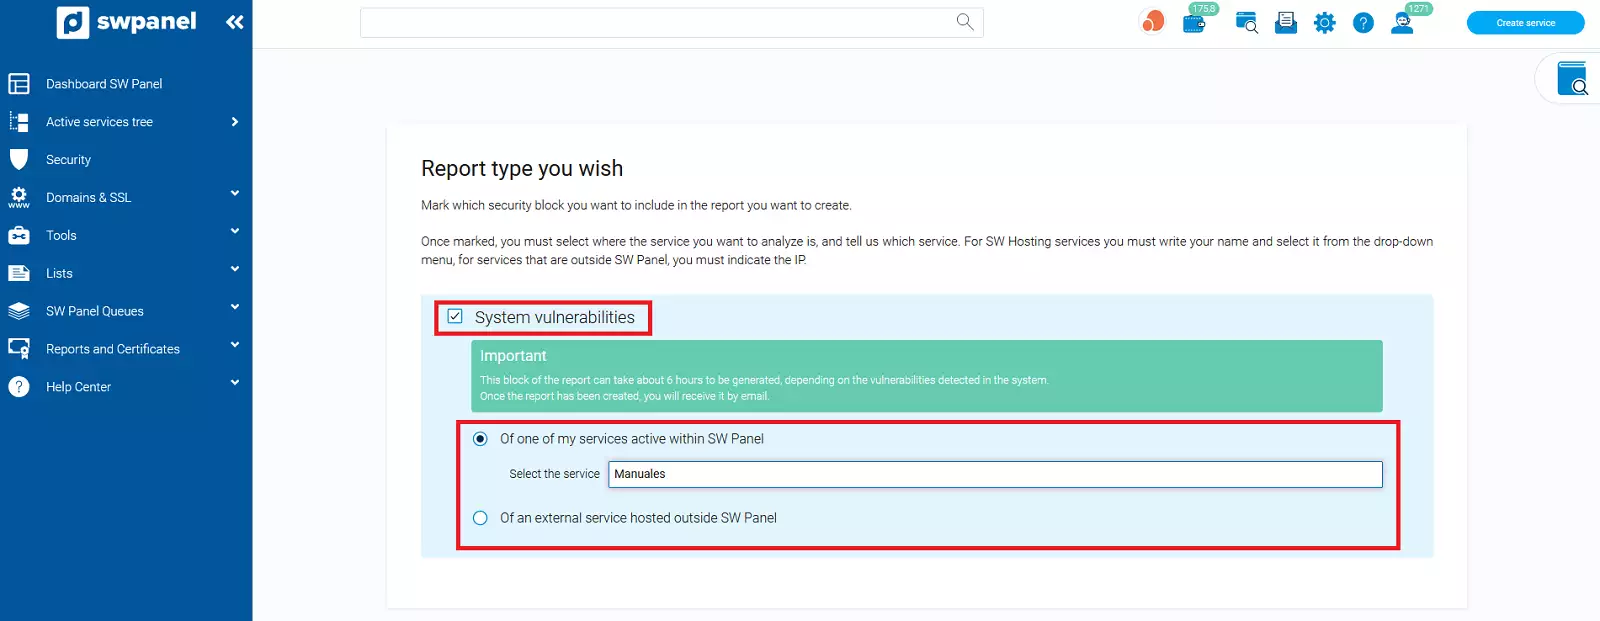
You can obtain a report by clicking on "Request a report now", then choosing the type of report you want and the email address where it will be sent. There is a small charge for the report.

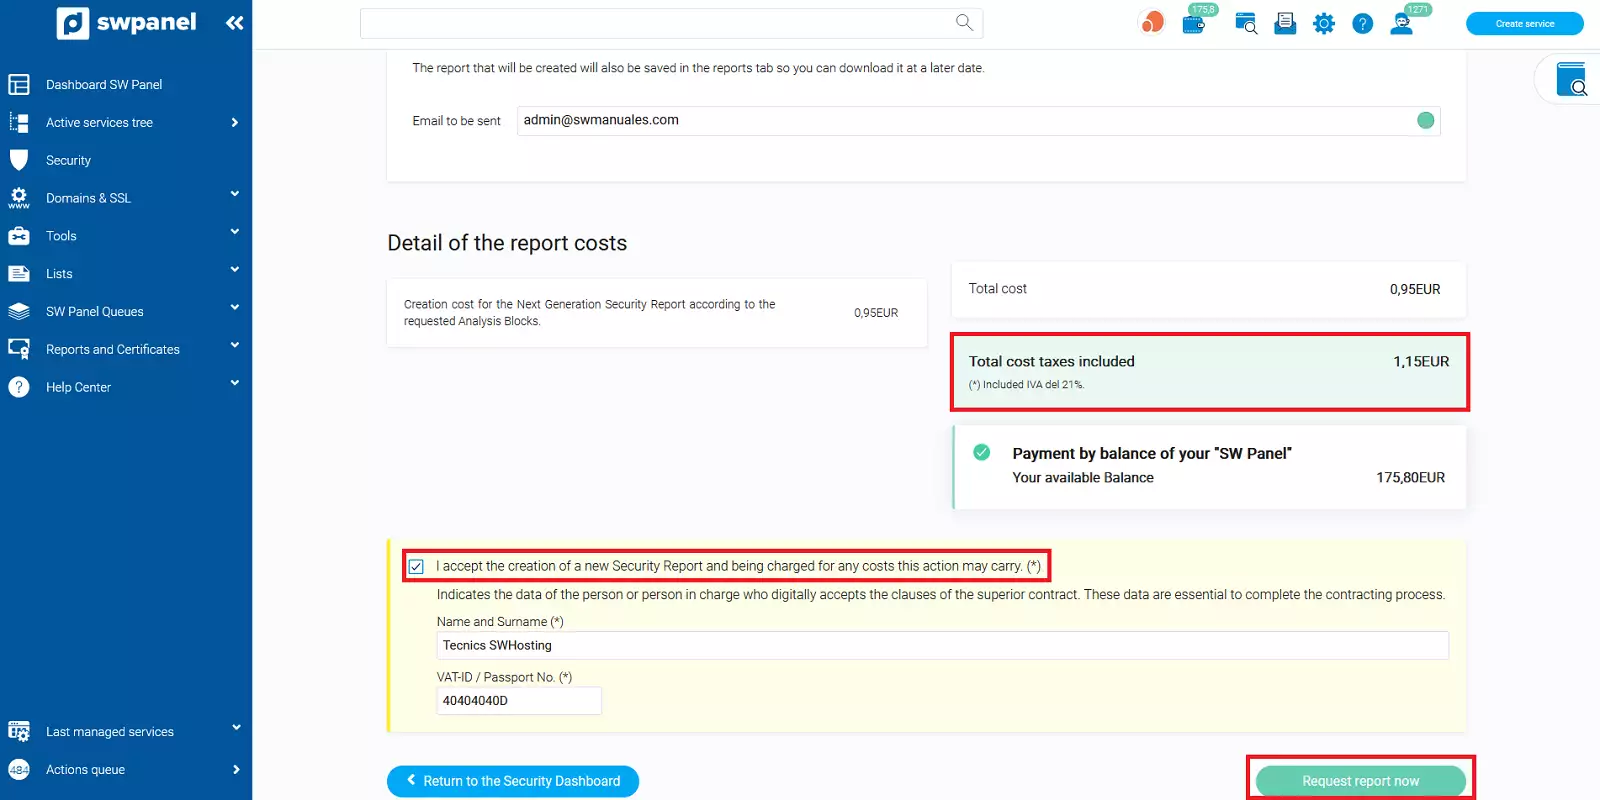
Security Dashboard: Threats addressed by Next-Generation Security
This option is only visible for customers with active Next Generation Security. It shows a top 10 of threats received or originated by type, country of origin, severity and total.
To activate Next Generation Security, you must follow the steps below:
-
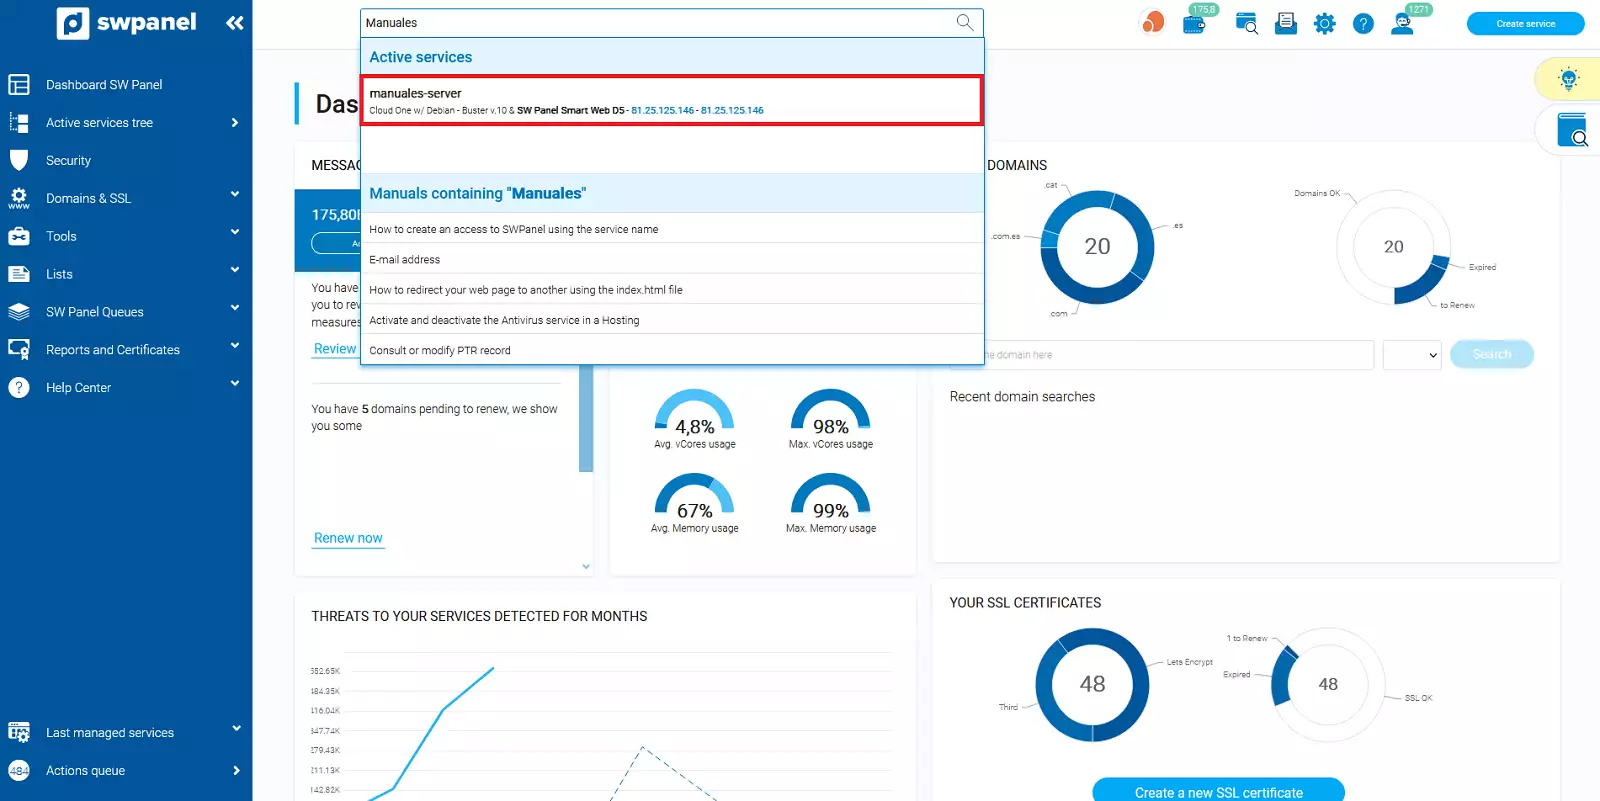
Inside your SWPanel use the search engine to find your Cloud, in our case it is called manuals-server, yours will have a different name. Once you find it, select it.
-
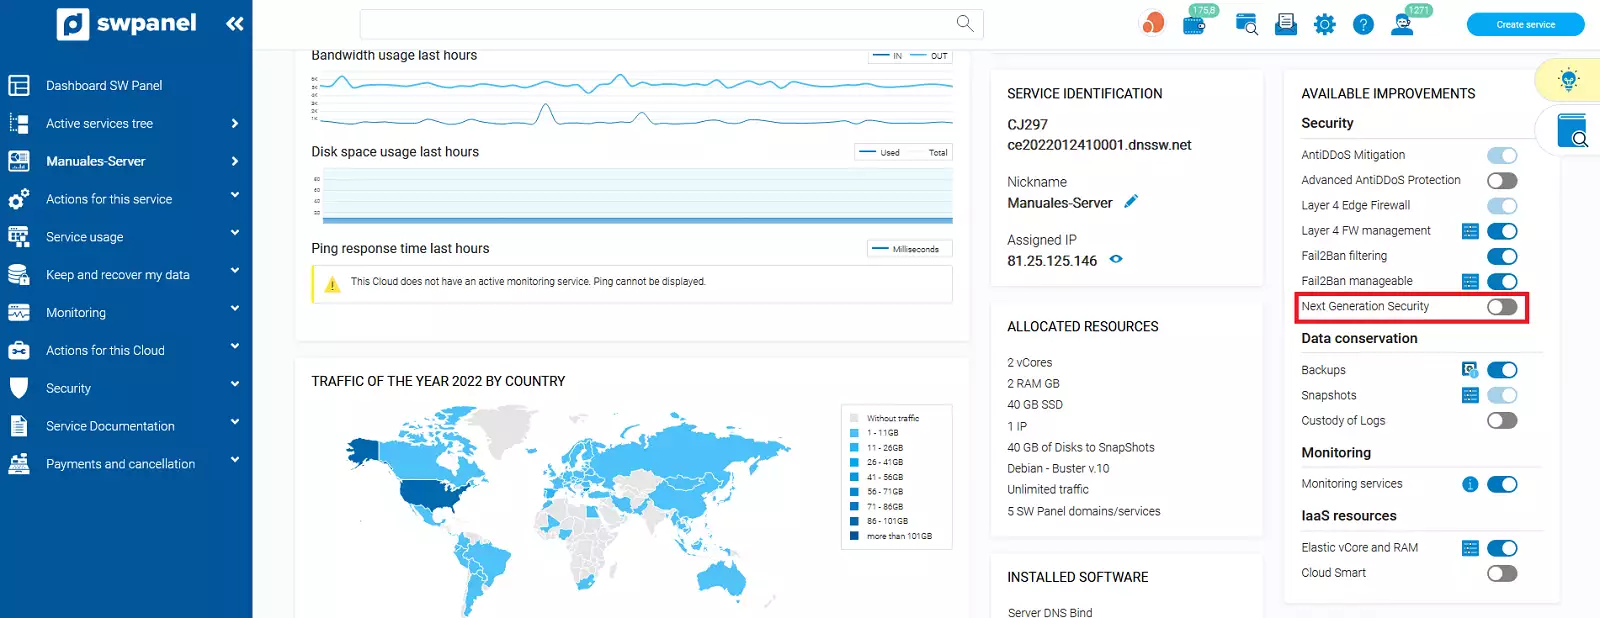
Next, go to the "Available Upgrades" section and select "Next Generation Security":
-
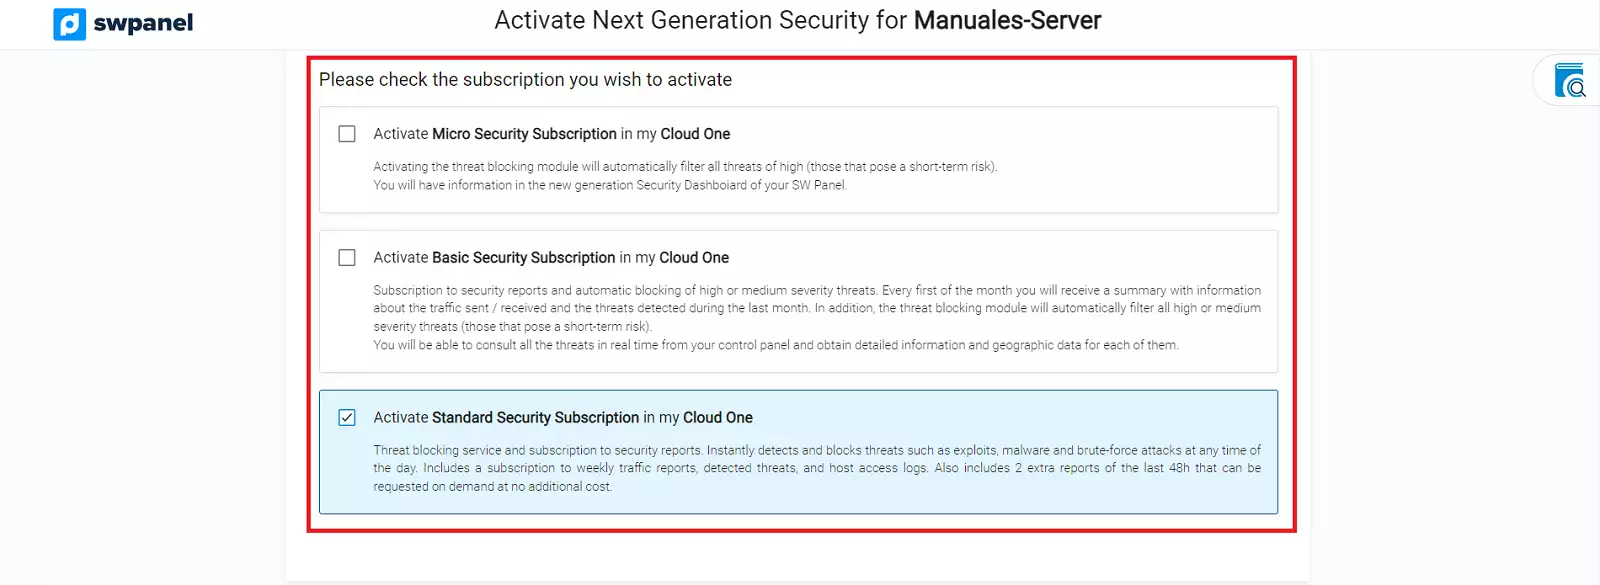
To continue, select the type of security you want:
-
Once selected, you must formalize the payment:
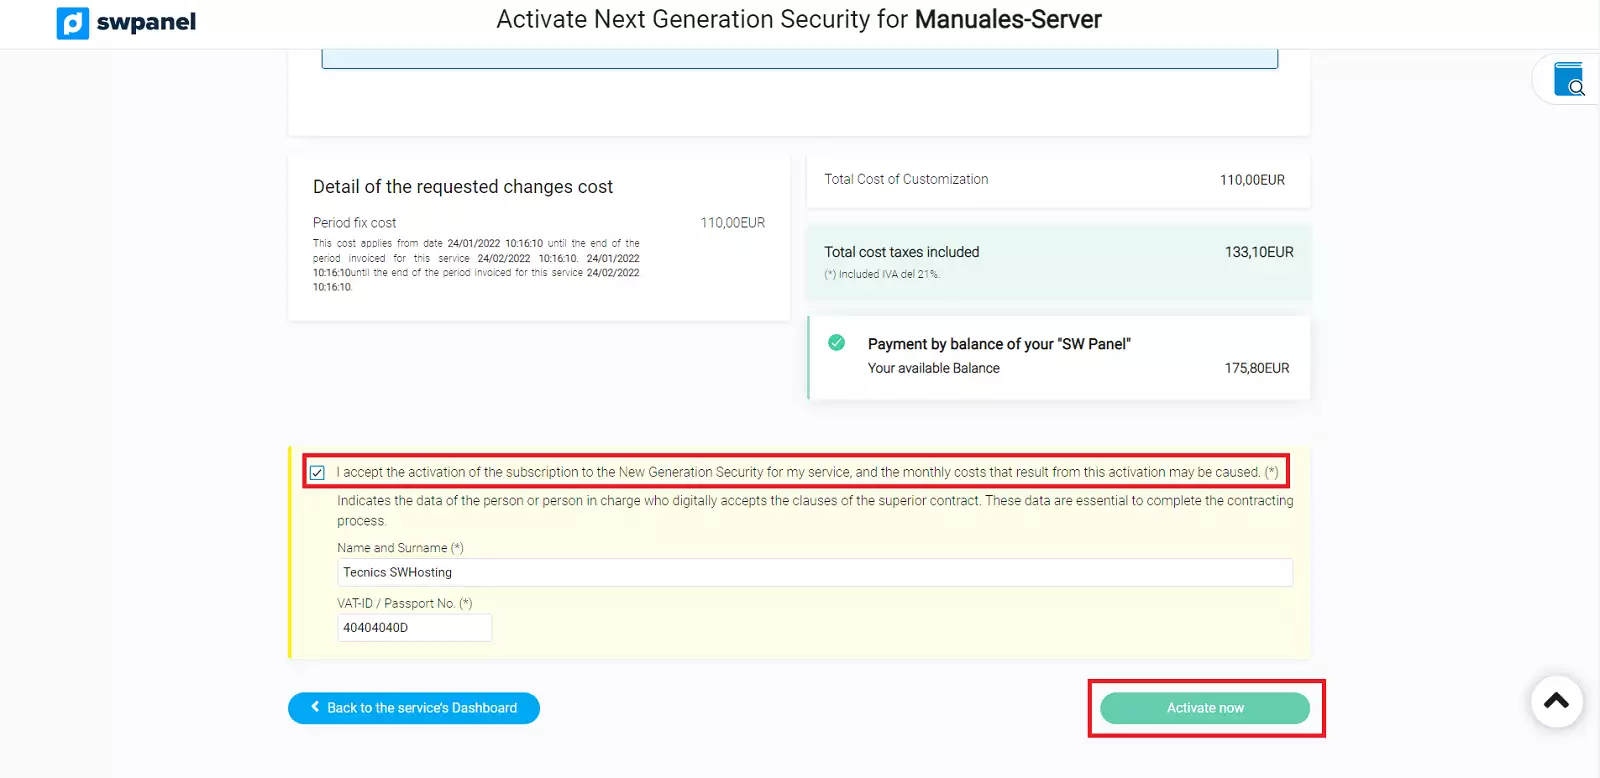
When your Next Generation Security is activated, you will see in your service tree, your Cloud server with a shield on the right and the description "This service has a subscription to a Next Generation Security Level". If you click on the shield, you will access the Next Generation Security menu for Name of your Cloud Server, which we will explain below.
Next Generation Security menu
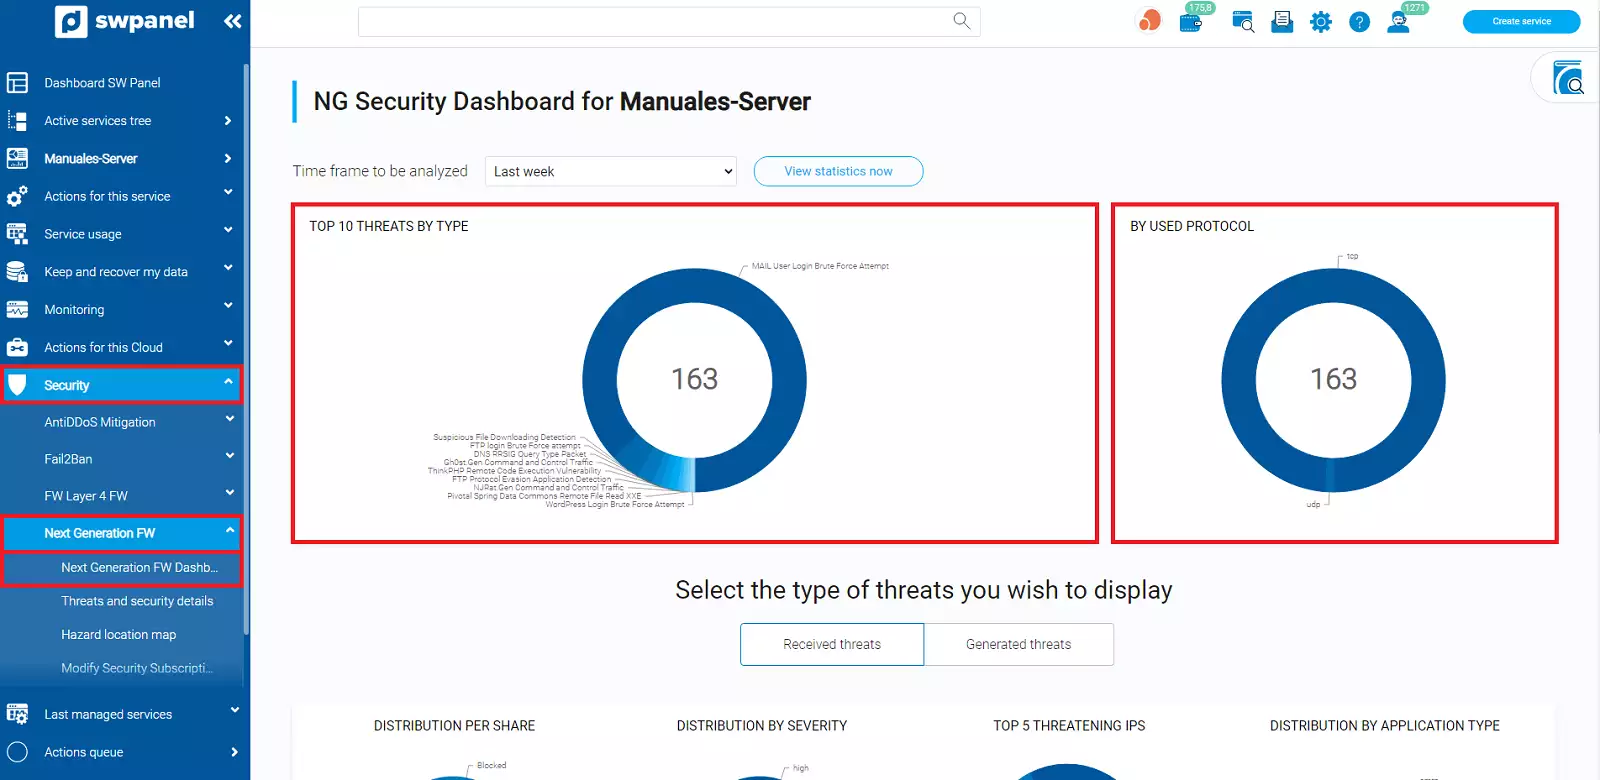
In this menu you will be able to see graphs about the types of threats received and protocol used. In addition you can also see if any threat is generated from your server.
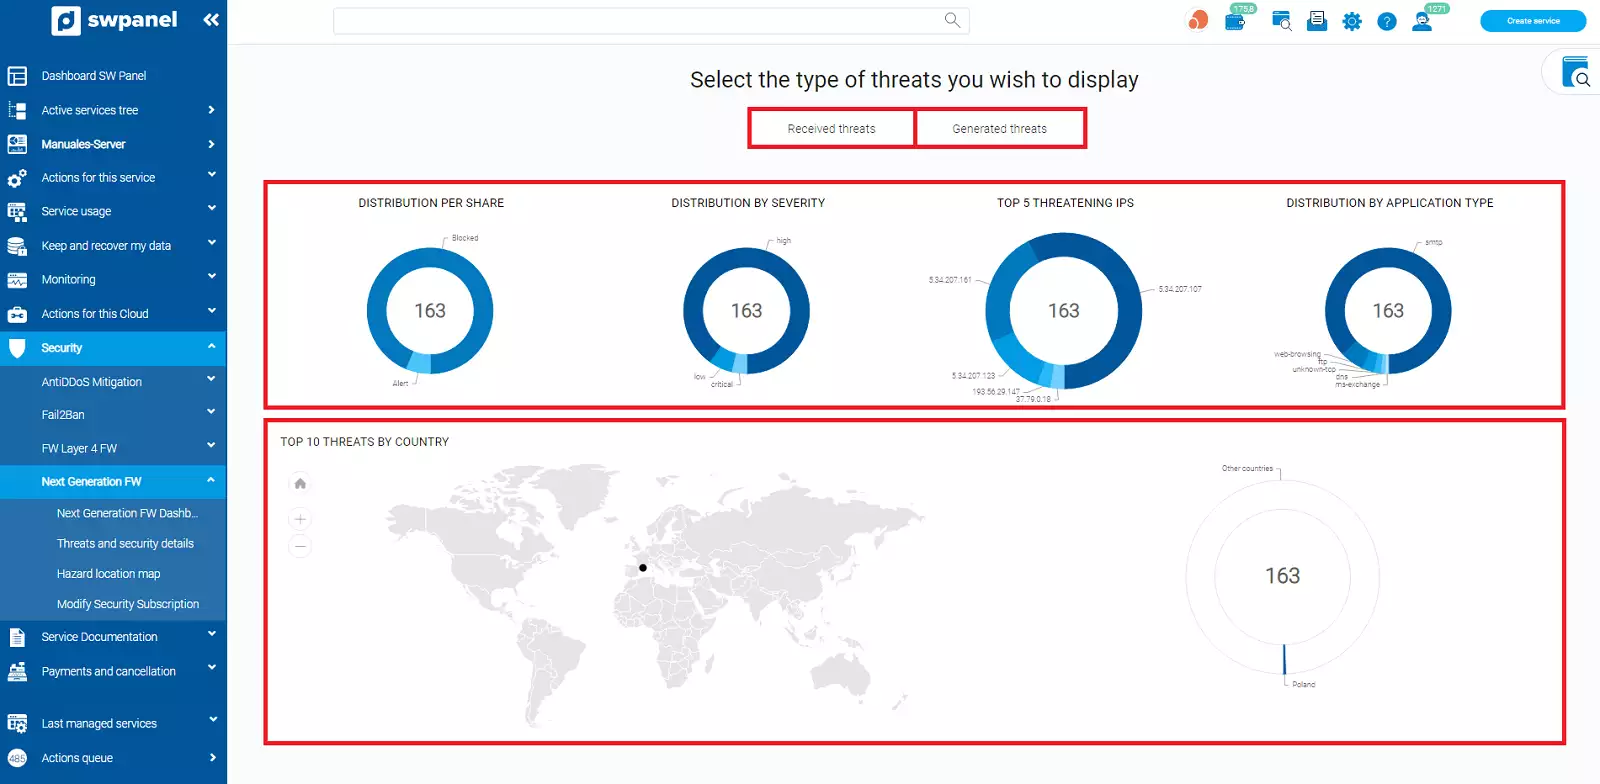
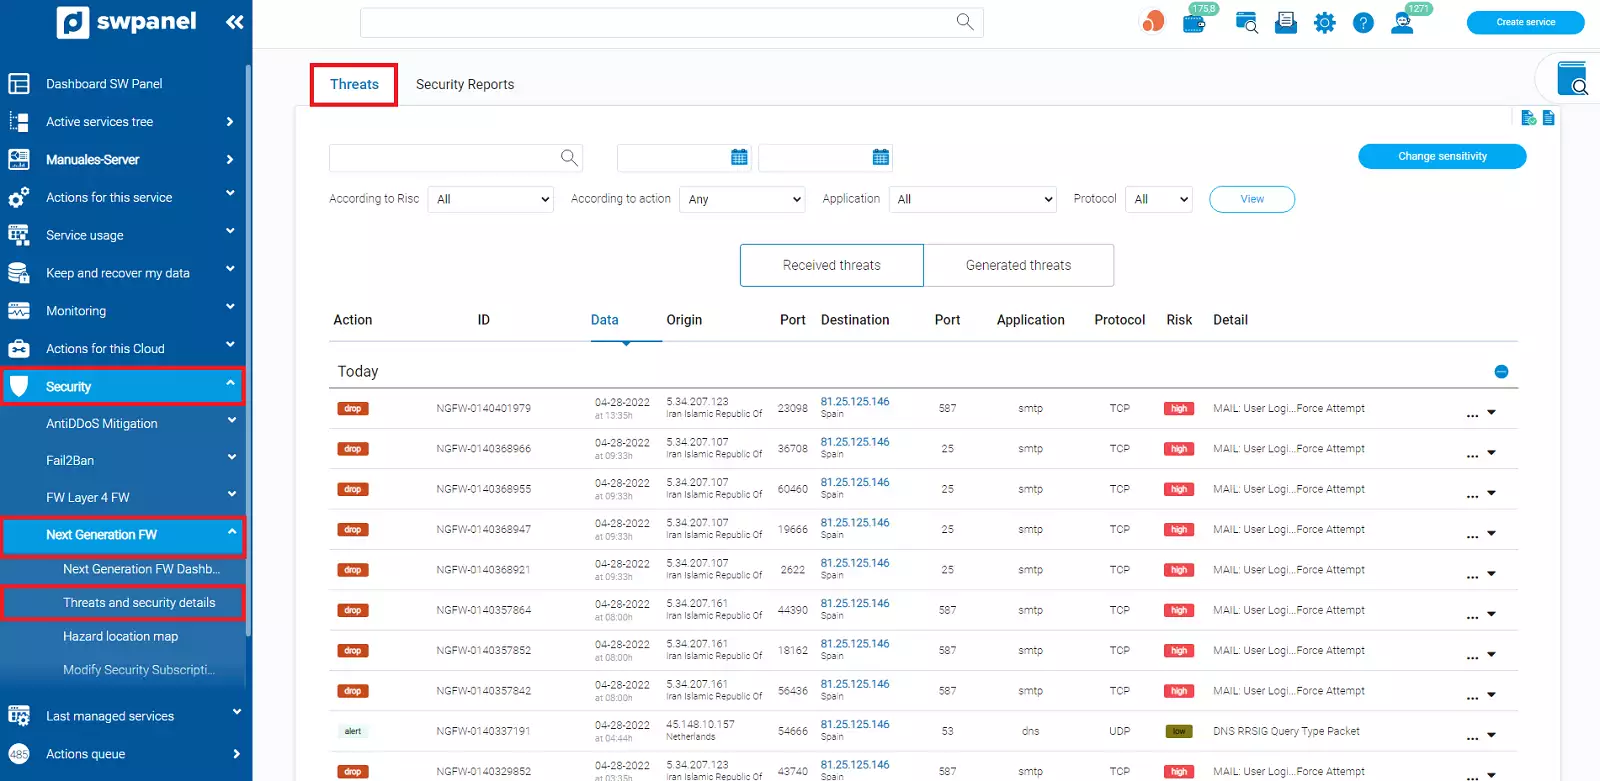
In the Threats tab, you will be able to see the threats in general, both those received and those generated by your own server.
In Security Reports, you will be able to request a Network or Perimeter Security and Vulnerabilities report of your Cloud server system in a short period of time, maximum 6 hours.
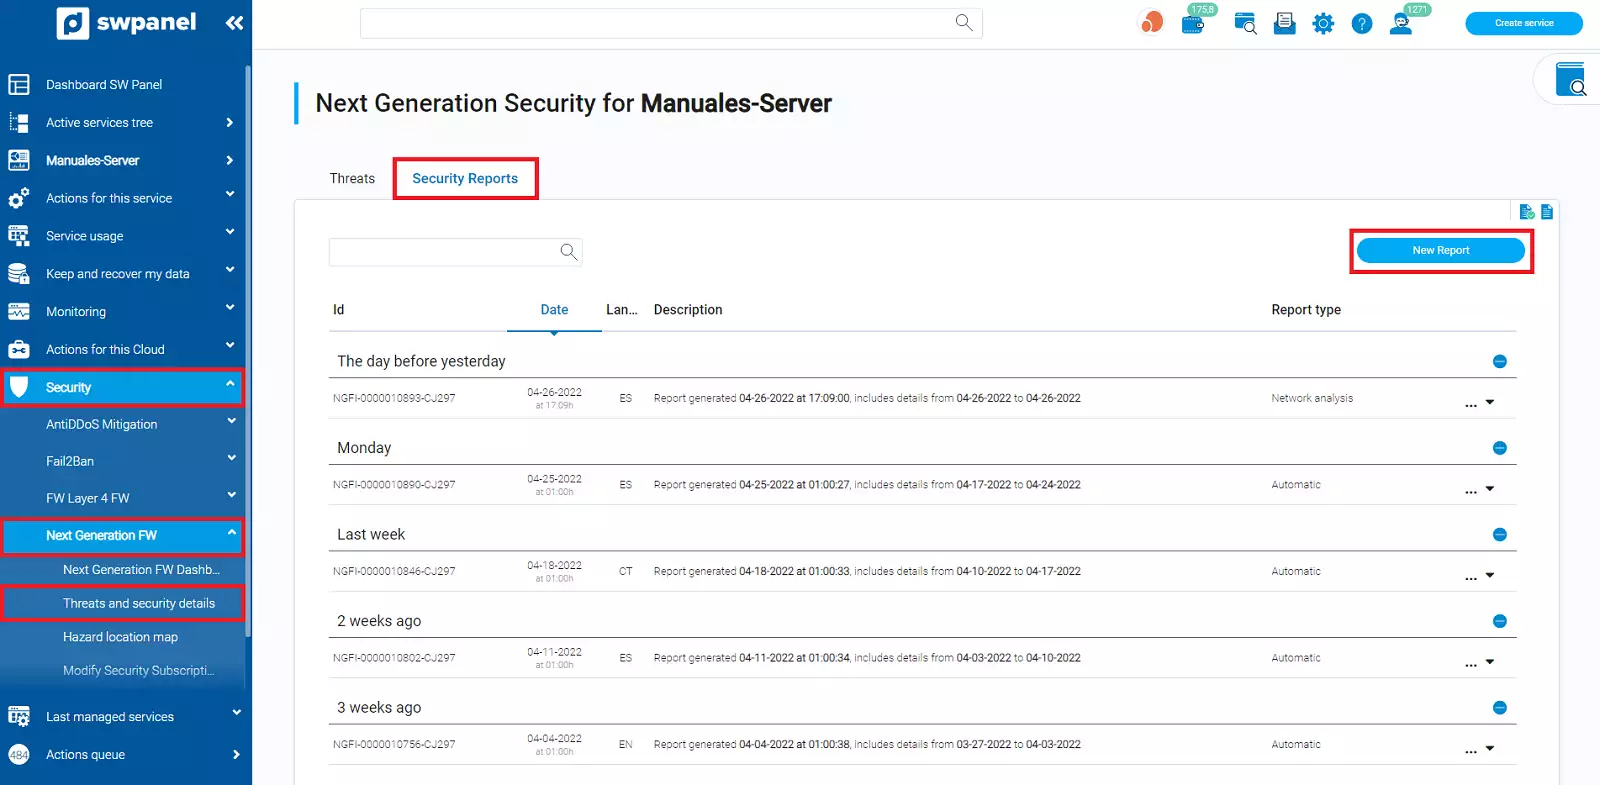
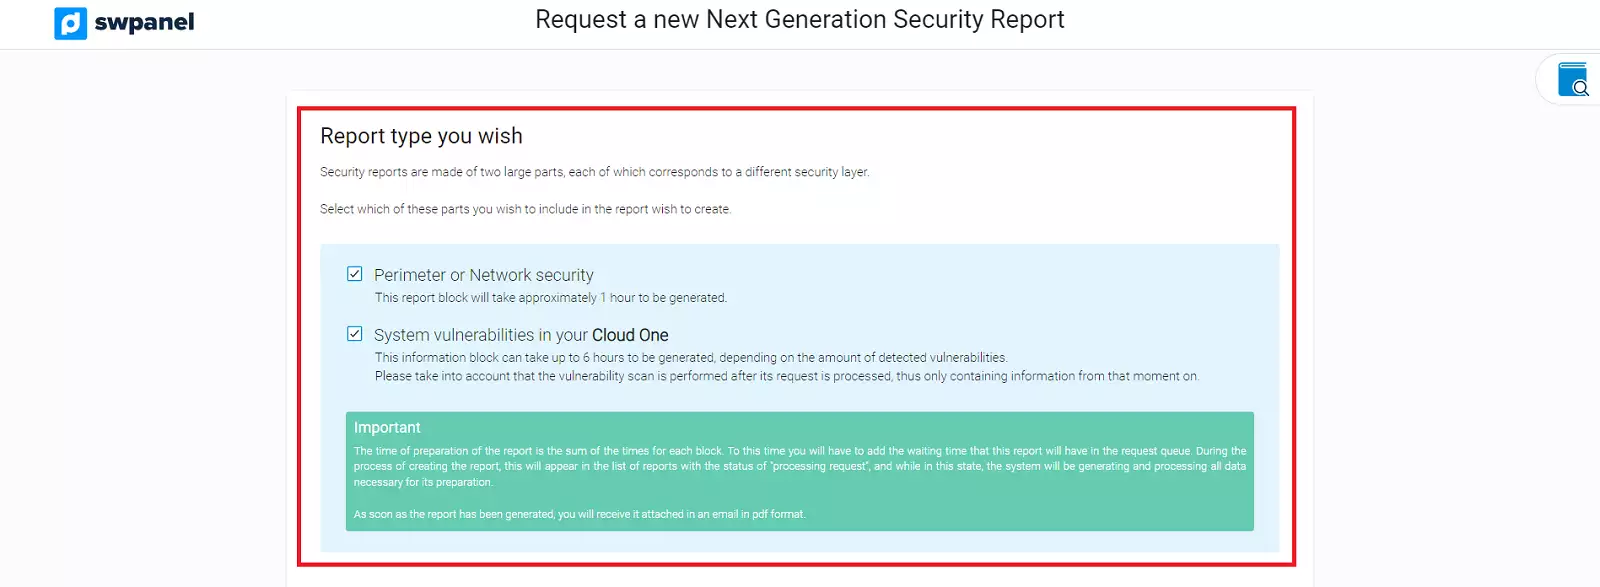
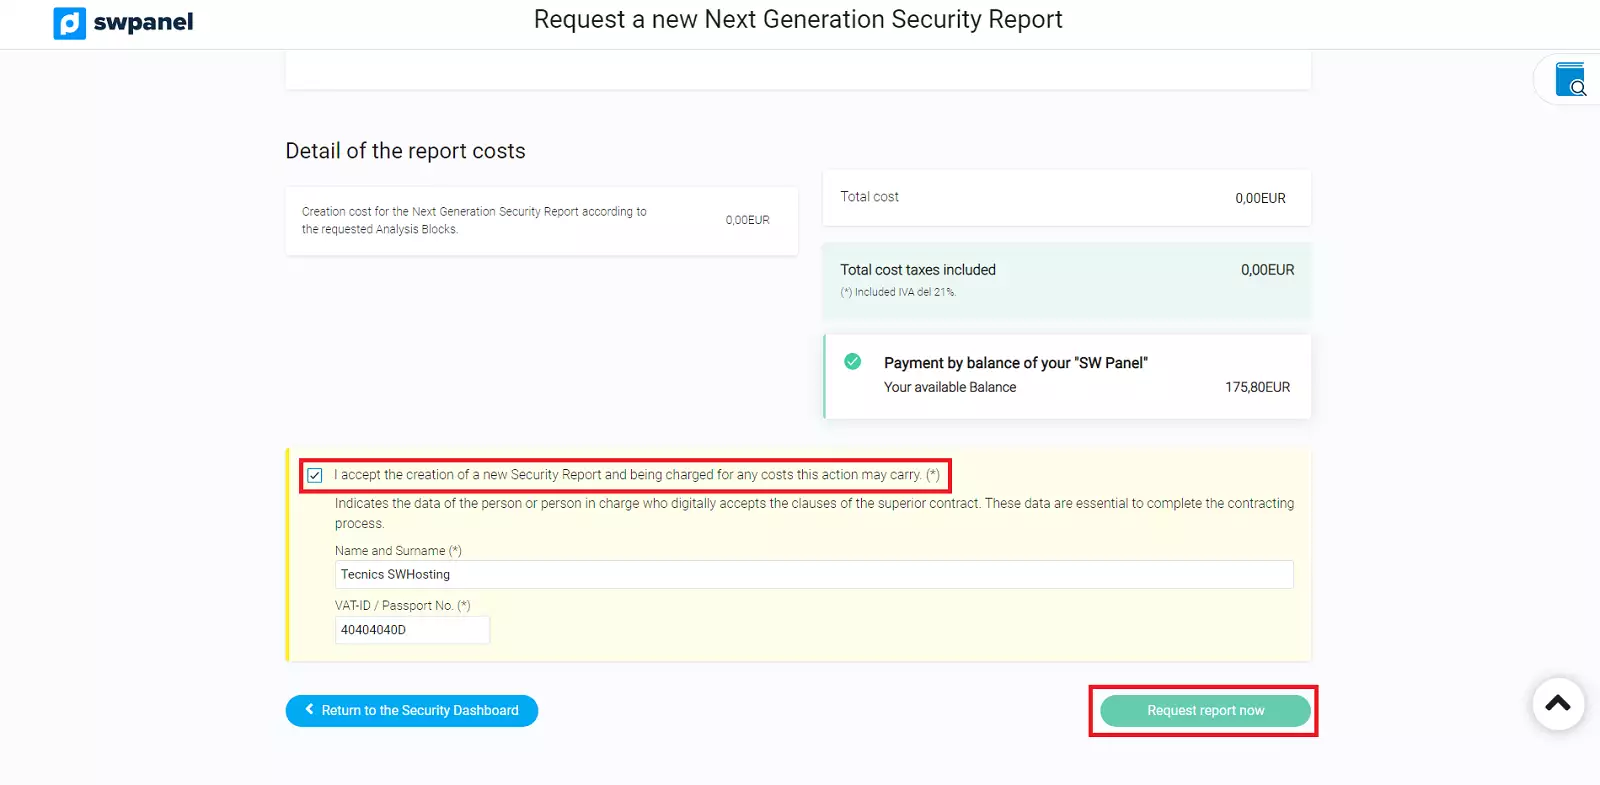
You will be able to indicate the type of report and the start and end date of the report. The maximum number of days that the report can include is 31. Then, indicate where the mail will be sent and finally proceed to the formalization.

A sample report is attached below.